Historical GitHub contributions chart
Intro
Have you ever wondered which projects you have contributed to for last N years working in a %companyname%? Can you name them off the top of your head? For how long have you been working on them? How often did you return back to a project to fix it or add something new?
Why would it be interesting for you?
There could be several reasons:
- You want to update your CV and you have been working in a company for so long (4-5 years, maybe even more), so that it’s very hard to name a project you had touched at the beginning of your career. What if your job title (as well as your responsibilities) changed during this period? You’d need to recall all projects/teams, in a given time slice, that you were a part of, which might be a quite challenging task.
- Have a look at projects that were changed most frequently and how rapidly they were changed by you.
- Find projects that were abandoned.
- It’s just fun (because data is beautiful and we all like charts).
How do we get data?
The only source of this information is VCS (version control system). This component contains all necessary information about any changes we have done to our code base. Of course this only includes information about code changes and software engineer’s contributions are more than just a bunch of patches submitted to VCS, though having a commit history we can answer all the questions related to projects timeline and commits frequency.
There are plenty of VCS on a market, but the most popular one, as far as I can tell, is GitHub. There’s even a privately hosted option for those who care about security and don’t trust public instance.
Profile contributions heatmap
GitHub has a nice heatmap chart that you can see in a profile, which looks like this:
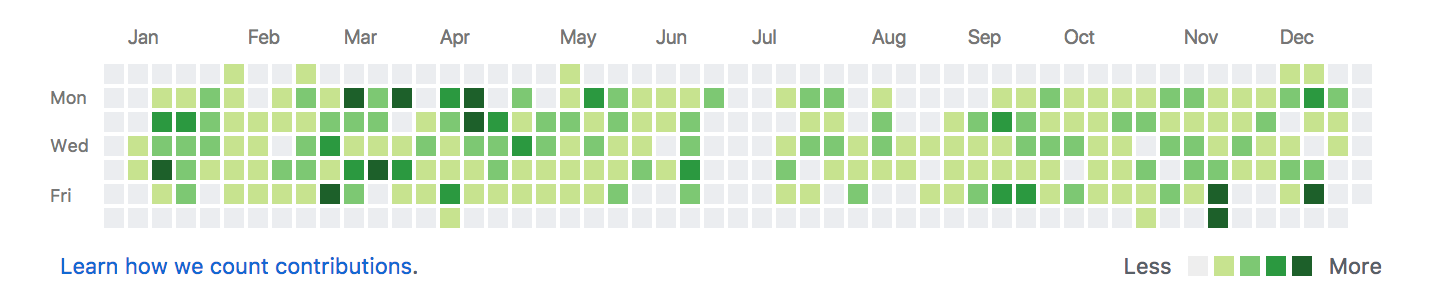
This heatmap is great but it’s just a heatmap and it doesn’t provide you with much information on affected projects (unless you click on a day, which brings you a list with details on changes happened over the specified day). This graph has only 2 dimensions: time (limited per 1 year) and total number of contributions per day (represented as variations in coloring). This might be very handy, though it doesn’t fit our needs as we want to see repository activities over the time since the first commit along with changes to other projects.
Heatmap internals
If GitHub front-page has AJAX heatmap, then, I’d assume, there should be some sort of internal API, that returns some parsable data, which we can reuse for our needs.
If you open user page on GitHub and open developer tools (or open your favorite tcpdump/wireshark), you’ll see that during page load, browser makes requests to other endpoints, which might be interesting for us:
https://github.com/users/uwiger/created_commits?from=2017-12-01&to=2017-12-29
https://github.com/users/uwiger/created_pull_requests?from=2017-12-01&to=2017-12-29
https://github.com/users/uwiger/created_pull_request_reviews?from=2017-12-01&to=2017-12-29
Though if you have a look at the response, you’ll see that response is HTML partials, which are loaded into profile page:
Is this parsable? Yes, it is. This is a very unreliable way to get what we need. Also, seems like enterprise GitHub (privately hosted instances) have slightly different version of UI (or might be behind the latest public version). As of this writing, I was not able to find mentioned endpoints on the enterprise version.
Heatmap SVG endpoint
By the way, while I was looking into the heatmap generation flow, I noticed another endpoint, which returns back SVG with a heatmap over a given period:
https://github.com/users/uwiger/contributions?from=2015-12-01&to=2015-12-31
This returns SVG document:

Which is very handy if you want to embed a heatmap into your personal page, but completely useless for us.
Events performed by a user
GitHub provides an API to list events performed by user. This includes all sorts of actions, that can be performed by user: changes pushed to repo, created an issue/PR, made a comment, etc.
Events API look like something we could’ve used to get all user’s events, though, unfortunately, I was not able to list events for a user older than 90(ish?) days.
Repository contributors stats
Ok, how about contributors statistics that are available by
https://github.com/<owner>/<repo_name>/graphs/contributors? How is it get generated?
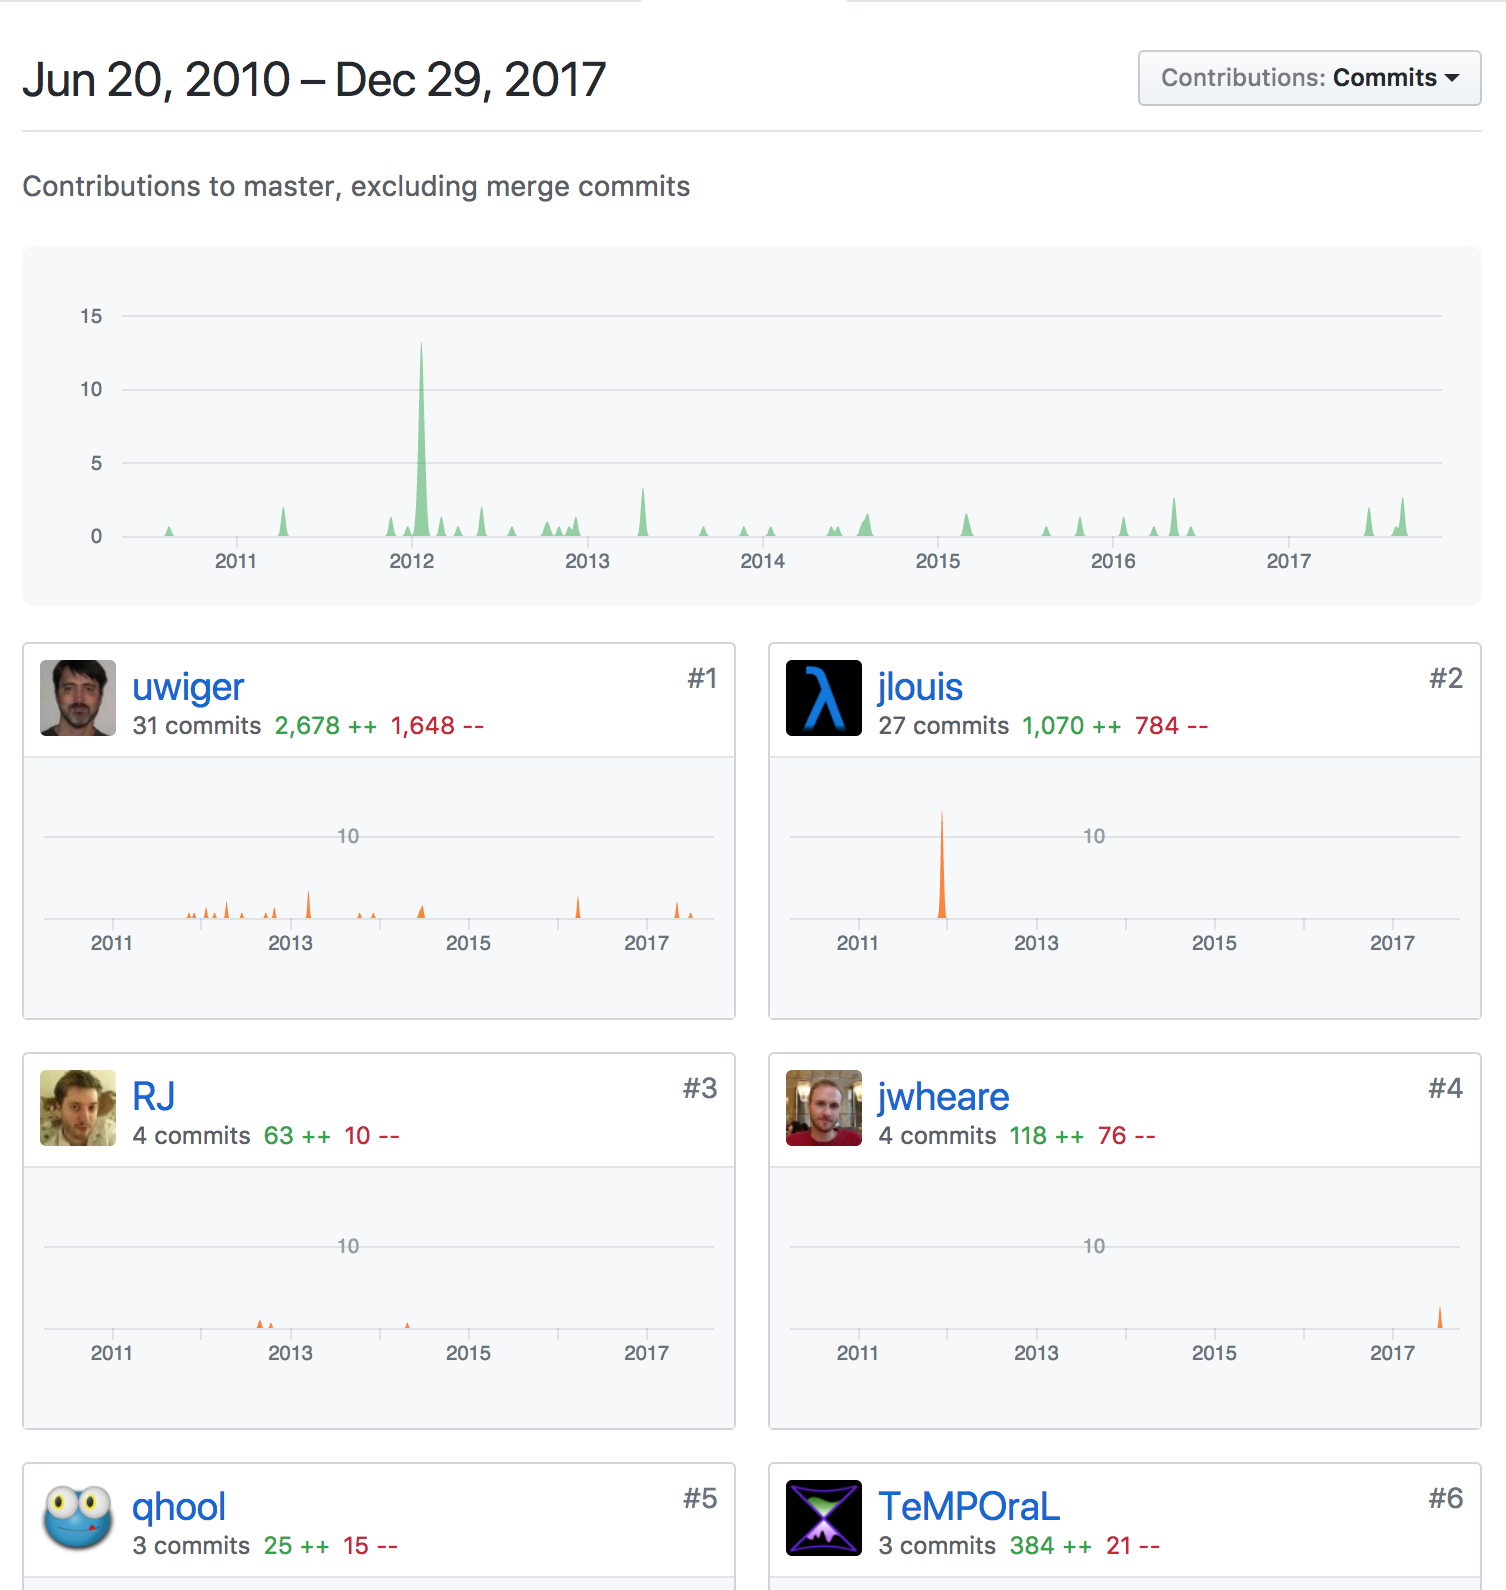
It appears to be there’s a publicly available statistic API for it which was designed solely for visualization purposes:
The Repository Statistics API allows you to fetch the data that GitHub uses for visualizing different types of repository activity.
Great! We’ve found what we need. This API can answer all our questions for a single repository. The last left question is how do we get all the repositories?
GraphQL
The most common setup, as far as I can see is that each GitHub user is a member of 0 or more organizations which they contribute to. Usually, there’re not that many GitHub organizations within the same company and this list can be either found via API or well known by a user.
GitHub provides 2 versions of APIs to get an access to data:
Let’s use GraphQL (or at least wherever it’s possible, some data is not yet available for v4 API) as it seems to be the latest available version of API. If you’ve never heard of it, I’d recommend to read about it: Introduction to GraphQL.
I’m not going to list and explain all used queries as they are available in a script itself and pretty much self-descriptive, but here’s one of the queries so that you understand what I’m talking about:
Having these 2 files, where user-organizations.gql is a GraphQL request and
variables.json are variables for the query:
In order to get a list of organizations, you need to make a post request to
https://api.github.com/graphql (don’t forget to pass Authorization: bearer
<token> header with valid GitHub token):
And that should return back something similar to this:
Getting data
To get all necessary data you can use this script: velimir0xff/contributions.
Usage
- Clone it:
$ git clone [email protected]:velimir0xff/contributions.git && cd contributions - Install dependencies:
pip install -r ./requirements.txt - Set GITHUB_TOKEN environment variable. It’s required to talk to GraphQL endpoint:
$ export GITHUB_TOKEN=<token>. You can get token on token page. - Run script:
./contributions.py > stats.json. See details on the script readme page.
Once script is launched it should print out progress bar, unless --no-progress
flag is set, and you’ll something similar to this:
Please note that getting repository contributions statistic is an expensive
operation. If you want to run this script against company’s GitHub instance then
it’s worth to talk to SRE first about it and let them know about upcoming load.
Script runs only in a single thread, but it utilizes aiohttp/ascynio (which is a
separate topic) to make asynchronous requests. By default, script doesn’t make
more than 20 concurrent requests, but this setting is configurable via -m and
-c flags.
Data visualization
To get a better view on the project contributions timeline, it’d be nice to show the project activities with their duration over time. The closest to the desired type of a chart, which I can think of, is Gantt chart, except in our case the rendered graph will be a simplified version it.
Within the same repository,
there’s jupyter notebook - contributions.ipynb, which builds graphs similar to
what you can see at the end of the post. It gets data from a specified json file
(you can find example file examples/uwiger.json), groups all adjacent
activities into streaks (those contributions, where there’s no more than 30
days between commits) and color them based on the average number of commits per streak.
Result
Here’s an example of my top 20 contributions by the longest duration (private GitHub, all names are obviously made up):
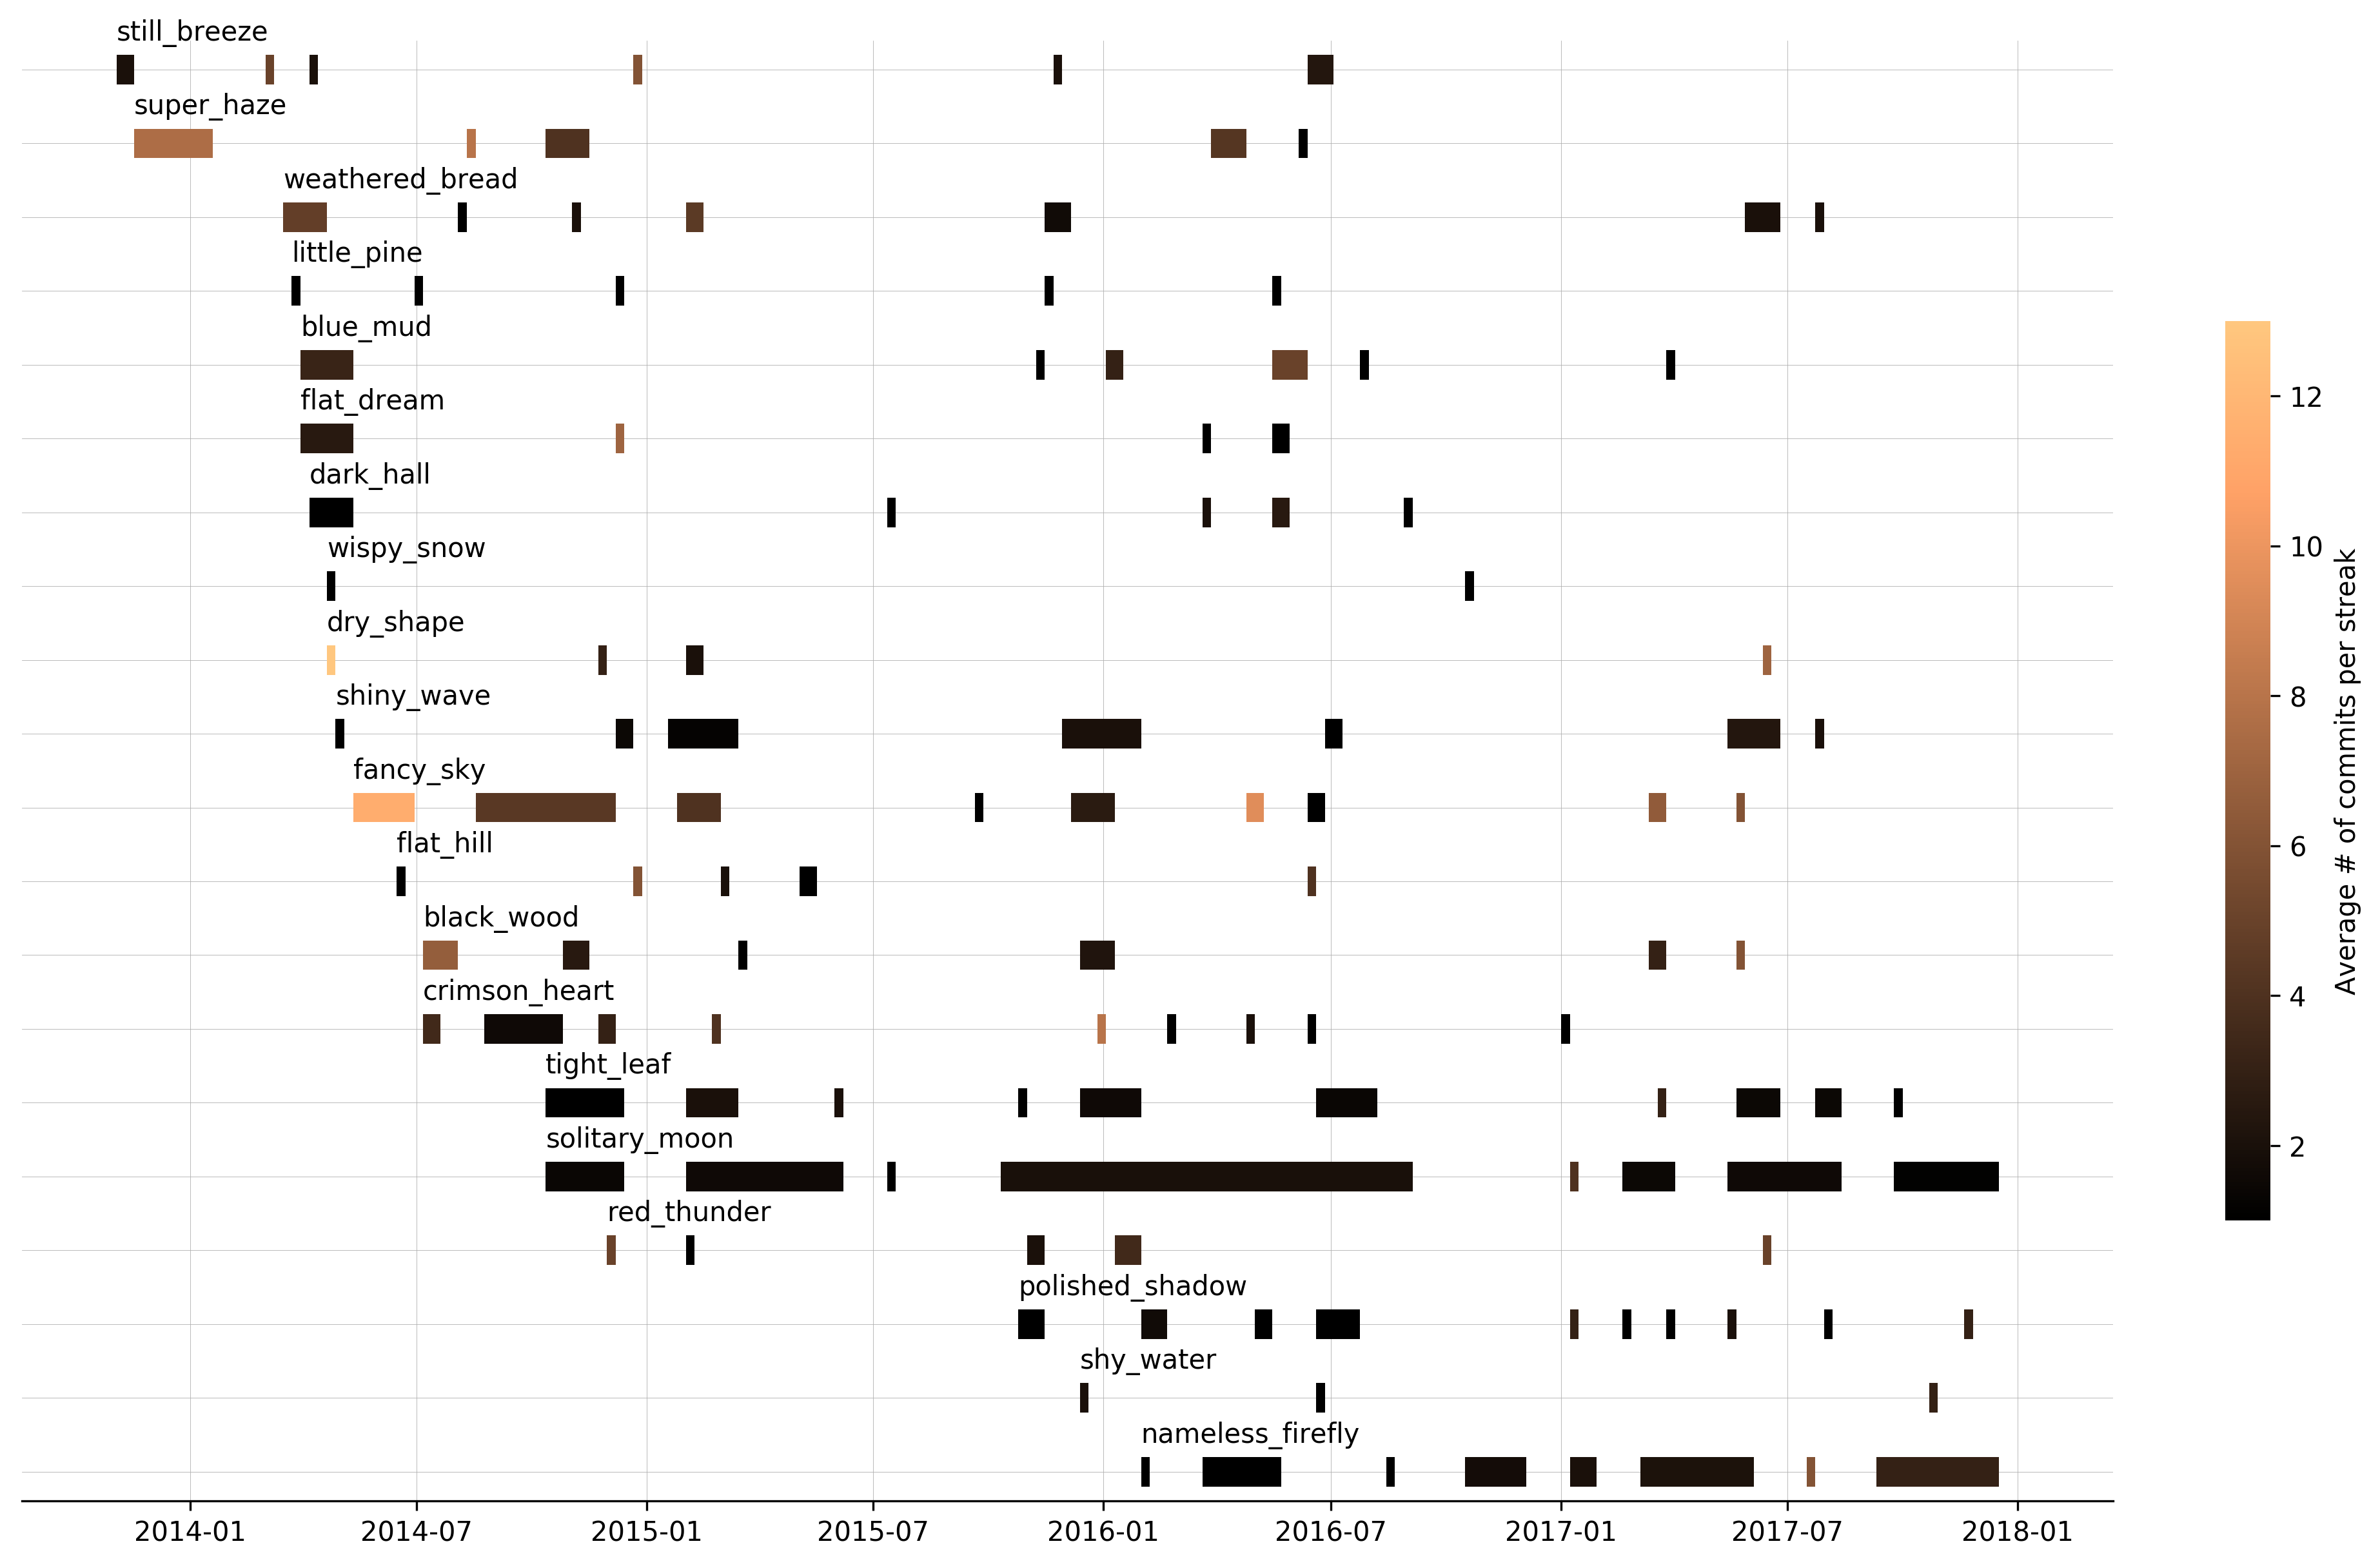
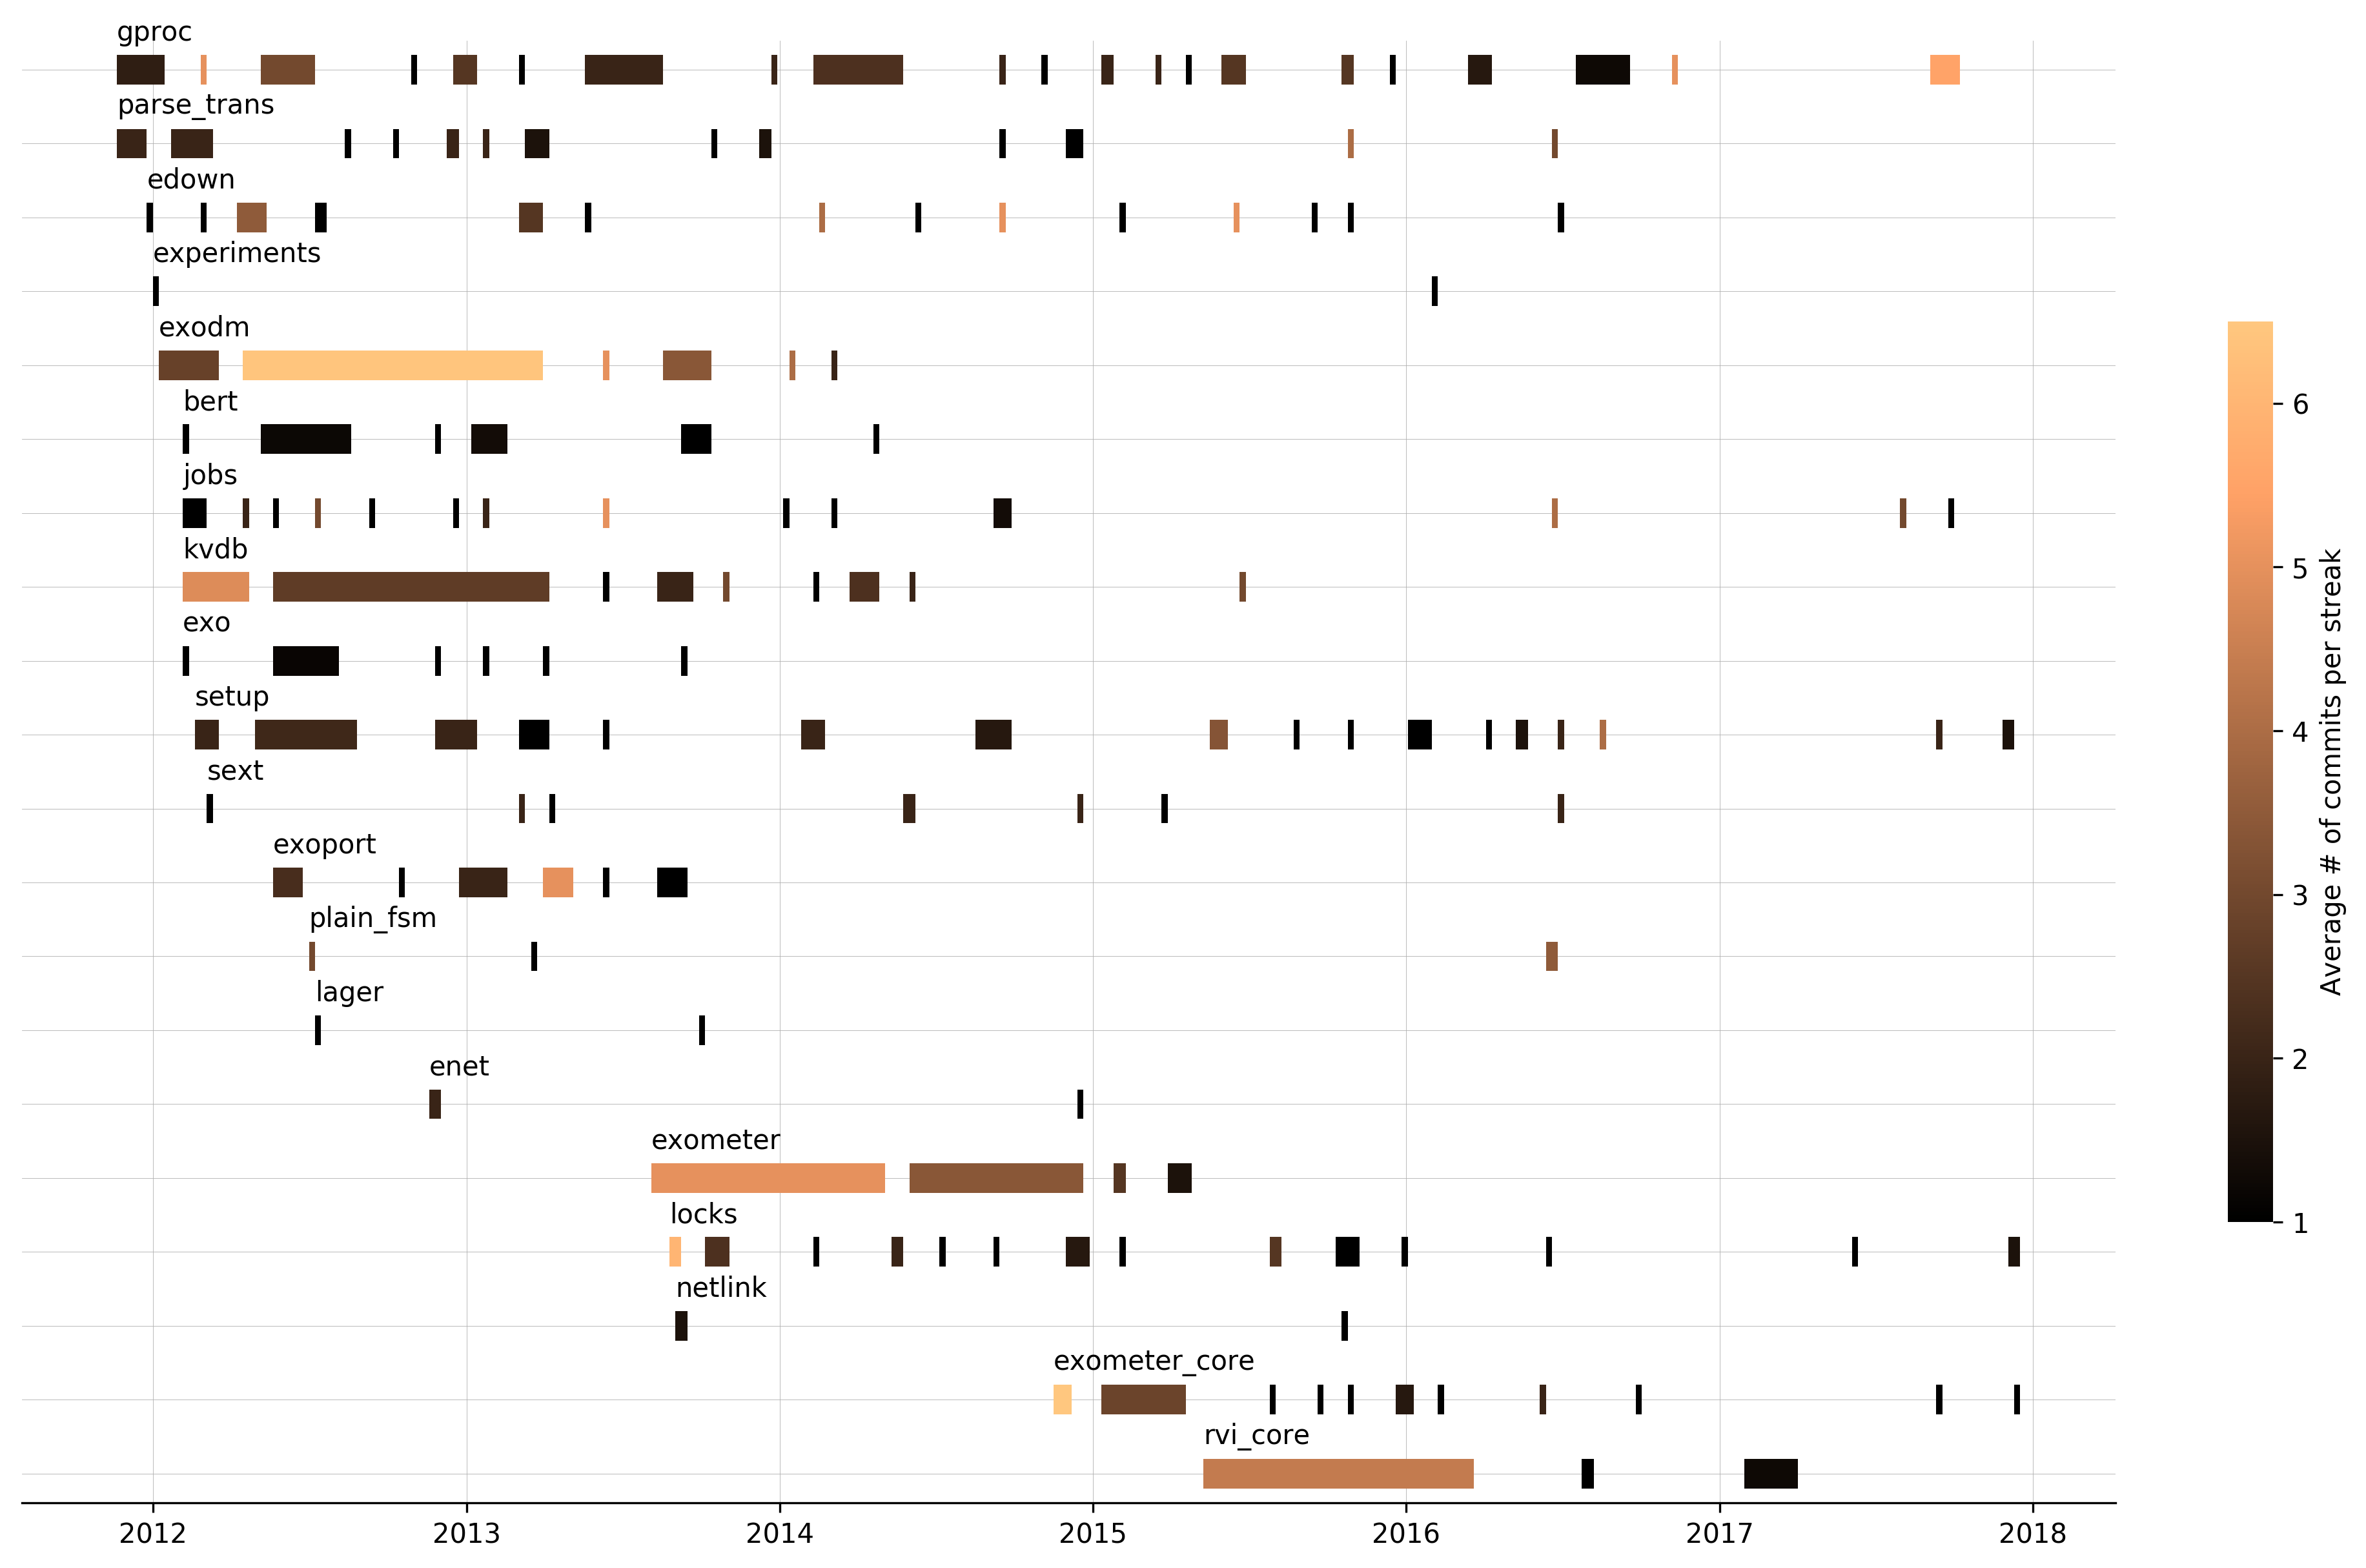
And here’s a top 20 for Ulf Wiger:
And here are charts for all contributions were made by myself since I changed the job last time:
All Ulf Wiger contributions found on public GitHub:
Click on images to get pictures in a higher resolution.
Please note, that I’m not trying to compare myself and Ulf Wiger :) He was the first person who appeared in my mind, when I searched for someone with a nice representetive GitHub activity.
You can find script and notebook with examples here: https://github.com/velimir0xff/contributions
If you found something wrong or just want to add/fix something in the script please let me know via PR/issue or email. I’ll be happy to merge and/or answer any question. Hope you’ll find it useful.